
POTENTIAL AND CURRENT DYNAMICS AT
THE ELECTRIC BREAKDOWN OF ATOMIC GAS IN A SHIELDED TUBE WITHĀ THE GROUNDED ANODE
1.
Introduction.
The ability to propagation
is one of the basic properties of the non-stationary electric discharge. However in different discharges it is shown
in a various degree and differently. So Āsome modes of the impulse
capillary erosive discharge, considered in connection with experimental modelling of the ball
lightning (BL) [1], differ fast
development from an interelectrode gap (~ 3-25 millimeters) thin (some
millimeters) and long (some tens centimeters) plasma jet having complex Ācurrent system [2] . In [3] we denoted analogy of this process to movement of the breakdown waveÆs leader though in these two cases set of the transfer
phenomenaĀ hasĀ obvious distinctions. For clearing one side of the propagation
mechanism and discharge structure formationĀĀĀĀ
we shall consider some special cases of electric breakdown: Āprebreakdown
condition and breakdown at slow increase of negative voltage relative to the
period of a breakdown wave movement, the pulse
breakdown and, probably, breakdown via high-frequency andĀ microwaveĀ
pulse, the gliding discharge. In spite of the fact that original
experiments had been carried out one and a half decades ago, the presentĀ expanded reproduction, in our opinion, has
not lost the barest necessity. In principle, all considered sides of the
breakdown phenomenon are mentioned in [4], we shall take concrete cases and receive concrete dependences of parameters at the measurements.
2.
Experiment
procedure.
For the experimental description of breakdown as complex electric
process the measurement of potentials and currents in the circuit, one element
withĀ distributedĀĀ and variable in time parameters of which is
plasma, is necessary. Therefore we measured dependences on the time of the cathode
potentialĀ U0 (t) and at 56
points lk along the plasma volume Upl (lk, t),
total current onto the ground I (t), current onto the grounded anode Ia
(t) and the displacement current Ib (t) onto grounded shield.
Reception of these
parameters measurements being least dependent from each other can be achieved
only under small enough diameter of plasma volume relative to distance between
electrodes, small distance between a probe and plasma, and also in the presence
of a screen placed close enough to plasma and isolator between it and plasma.
(Then the displacement current increases and substitutes for the conduction
current onto the shield, but the measured currents are interpreted
unequivocally and have classical sense.) These requirements are satisfied in a
sufficient degreeĀ in the case of a thin
long dielectric tube with gas of the lowered pressure placed in a metal pipe,
diameter of which Dp is much less than a interelectrode distance L but
is much more than diameter of discharge tube Dt and, accordingly,
than diameter of cylindrical plasma volume dpl , i.e.:
L>>Dp>>Ā Dt ~ dpl ,ĀĀĀĀĀĀĀĀĀĀĀĀĀĀĀĀĀĀĀĀĀĀ (1)
and distance between the end of a probe Rz and plasma dpl
/2 is about radius of an aperture of the tube dt,Ā step of a probe Dl is about the distance from the probe end to axis of
a tube:
Rz ¢ dpl
/2 ~ dt /2ĀĀĀĀĀĀĀĀĀĀĀĀĀĀĀĀĀ
(2)
Dl = (lk ¢ lk-1 ) ~ RzĀĀĀĀĀĀĀĀĀĀĀĀĀĀĀĀ (3)
In view of the big
resistance of a breakdown plasma under slow increase of a voltage and the big
role of the displacement currentĀ the
placing of a probe inside of a tube results in significant distortions of all
researched process. In this situation the most simple decision represents the
application of a capacitive probe which is placed near to a tube butĀ small enough in size. The best form of a
probe - a ball on the most thin wire but because of a low mechanical durability
of such design we used a wire probe as a relocatable one. When the wire diameter
is ~ dt /10 and condition (2) its capacity onto plasma Cz-pl
is about the one tenth share of a picofarad, when capacity of the probe onto
shield is Cz-sc = 15 nF the signal taking off Āfrom Cz-sc as a lower arm
of the capacitor divider, has magnitude of the order of a millivolt while
magnitude of Upl is of the order of a kilovolt. Even without the
voltage follower the time constant of this divider is t0 = Cz-sc . Rosc = 15 ms (resistance of the
oscillograph input is Rosc = 1MW). For a deviation of a
signal from true value of potential less than on ~ of 5 %, the linear increase
of cathode potential should result in breakdown during 1,5 ms. Such increase
will be slow when period of the breakdown wave movement is
aboutĀ ~ 10-5 sĀ and less. More big accuracy is hardly
expedient as there are also other sources of a mistake. Besides ones mentioned
aboveĀ and connected to a limit of the
resolution on axial coordinate there is also a mistake connected with the
neglect of radial distribution. So for example, the positive
streamer has very small diameter of the beginning part. In the given caseĀ the negative streamer is considered. For the
control ofĀ a probe influenceĀ the signal U0 (t) was recorded on
oscillograms Upl (lk, t) at all lk with the
help of a double-beam or double-channel oscillograph.
3. Experimental setup.
In view of the specified requirements the installation for creation and
researches of breakdown consisted of the shielded discharge tube, shaper of an increasing
negative voltage pulse, squarer, high-frequency and microwave pulses, measuring
resistors, capacitive probes and recording oscillographs with a videocamera.
The oscillograms displaying dependencesĀ
U0 (t), Upl (lk, t), I(t), Ia
(t) Ķ Ib (t)Ā were fixed by a videocamera, were entered in
a computer, andĀ axial distribution of
potential for the characteristic time momentsĀ
was determined from them. Videoshooting of a luminescence of discharge's
parts including a stroboscopic modeĀ
allowed to observe features of its radial and axial distribution, their
dynamics.
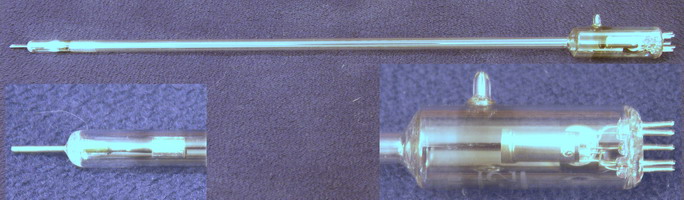
Fig.1. Discharge tube GSh-2 and its
electrodes. Anode (at the left) was used as the cathode.
As theĀ discharge tube the noise generator GSh-2 filled with a neon at pressure ~ 8 Torr ( Fig. 1) was used. Length of
the glass tube was 360 mm, the small diameter - 7 mm, the big diameter - 18 mm,
the distance between electrodes L = 310 mm, the distance between the anode and
the expanded part of the tube - 290 mm. The anode is located at 2 cm from the
ending of a tube of small diameter and represents a metal beaker in diameter
and length 4 mm opened to the second electrode and Āfixed axially at a wire lead in diameter 1,1 mm. The heated cathode as a disk in
diameter 6 mm was located orthogonally to axes of the tube and
inserted into a thin-walled tube in diameter 7 mm (in the experimentĀ the heat was not used).
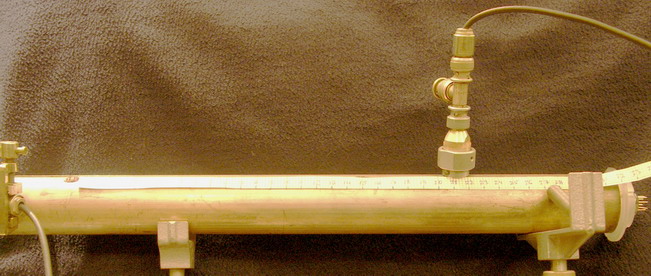
Fig. 2. Shielding pipe with the relocatable
and control
capacitive probes.
The discharge tube
settled down axially in a brass silvered pipe 34 x 40 mm
in the length 410 mm (fig. 2)Ā and was fixed on the end of big
diameter by a dielectric ringĀ and on
the other end - a metal disk. The disk had the central aperture with a spring
clip for wire lead of anode GSh and was fixed within a pipe without galvanic
contact to it by a dielectric ring or by a ring plunger creating a reliable
microwave short circuit of the electrode to shielding pipe. At the microwave
breakdown the pipe with internal diameter 20 mm was used, and the discharge
tube was a part of the central conductor of a coaxial line between a pulse
magnetron and a terminating load. In special
cases other schemata of inclusion of a tube in a screen were used also.
Shielding pipes had a longitudinal slit, and the shielding body of coaxial
leads of probes had grooves for fixing in a slit with an possisility of moving
along it (fig. 3) and contained feedthrough condenserĀ of the lower arm of capacitive divider Cz-sc .
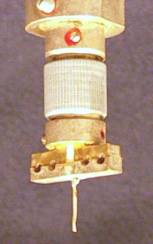
Fig. 3. A capacitive probe
The circuitĀ of the increasing negative voltage pulse
shaper is represented atĀ fig. 4. The
pulse from generator G5-63 triggered off the trace of a double-channel
oscillograph and with an adjustable delayĀ
the squarer which gave a pulse in duration 1 ms and voltage up to 25 kV.
This pulse carried out a fast charge of the condenser C1 = 100 pF
through the diode D1 (2 x ─1006) and resistor R1
= 1 kW with theĀ time
costant t1 = 0,1 ms. For return of the
circuit to the initial state before the following start the discharge of the condenser
C1 through resistor R2 = 100 MWĀ with the time constant t2
= 10
ms was realized. Condenser C1 charged condenser C2 = 15
pF through resistor R3 = 43,22 MW with theĀ time costant t3 = 0,65 ms. The triggering
regime wasĀĀ monopulse or periodicĀ with the least frequency at which the
process was periodic ŚĀ 10 Hz and
higher.
ąĶ±. 4. The circuit of the increasing negative voltage
pulse shaper.
The
voltage from condenser C2 (the
shaper's output) was given
onto the cathode of the discharge tube. Its anode and shielding pipe were grounded through measuring
resistors R4 = R3 =
2,645 kW accordingly the signals from which were
given onto double-channel (double-beam) oscillograph C1-83 (C1-74) for measurement
Ib
(t) Ķ Ia (t) (fig.
5). For measurement of total current I (t) = Ia (t) + Ib (t) the anode was joined to shield, and
amplification of the oscillograph was increased twice. ForĀ measurement of potentials the inputs of
theĀ oscillograph were switched to
outputs of the probes, and shielding pipe was grounded. For the
undistortedĀ display of small currents
of aĀ prebreakdown stage the voltage
limitersĀ 0,6 V of diodes were
included in parallel to the inputs of the oscillograph.
Fig. 5. Circuit of measured signals.
- Calibration of the relocatable probe.
For calibration the
relocatable probe was established against middle of the cathode (anode GSH),
and by means of moving of the second probe relative a cathodic conductor of the
circuit (fine tuning Cz-c) we achieved identical signals on outputs
of both probes at known amplitude of a pulse of microsecond duration. As the
charge, formed in plasma surrounding the cathode at development of prebreakdown process , changes a signal on the input of a probe, then for calibration
the mode of monopulse triggering was used when in rare cases a breakdown did
not occur, and the prebreakdown condition developed poorly (fig. 6).
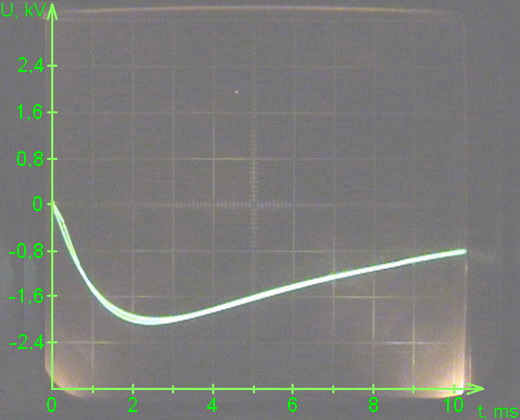
Fig. 6. The
oscillogram at calibration of a relocatable probe.
5.
Some
results of the measurements.
Voltage-current characteristic of GSh-2 without a shielding pipe with linear and logarithmic scale of a current
is represented at fig. 7.
Fig.7. Voltage-current characteristic of the discharge tube (the anode of GSh used as the
cathode).
AtĀ fig. 8. oscillograms of probes signals U0
(t) and Upl (l0,t) are represented. The relocatable probe
is placed against a cut of the cathode.
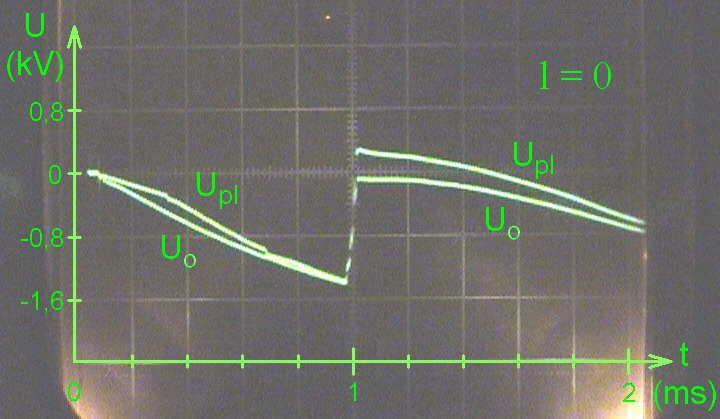
Fig. 8. The probe
signal at a cut of the cathode l0
= 0 at frequency of the triggering 10 Hz.
At fig. 9 the oscillogram
of the probe signal at the point of a tube axis with the maximal negative
residual potential before the triggering is presented l9 = 45 mm.
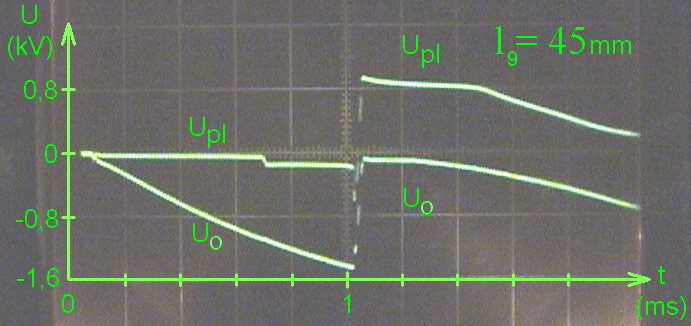
Fig.9. The probe signal at the point of a tube axis with the maximal negative
residual potential before the triggering is presented 10 Hz.
AtĀ fig. 10 the oscillogram of the total current
during breakdown and discharge is presented, and at fig.Ā 11 ŚĀ
the anode currentĀĀ Ia
(t) and the displacement currentĀ Ib
(t) onto the screen.
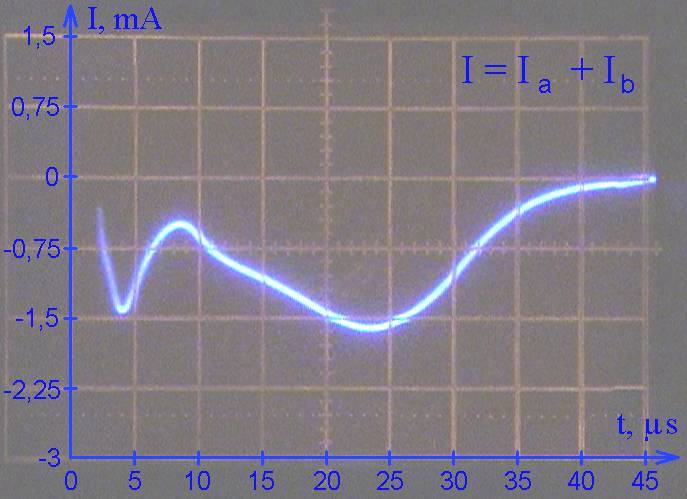
Fig. 10. Total current of the breakdown and discharge consisting
of the anode current Ia and the displacement current Ib
.
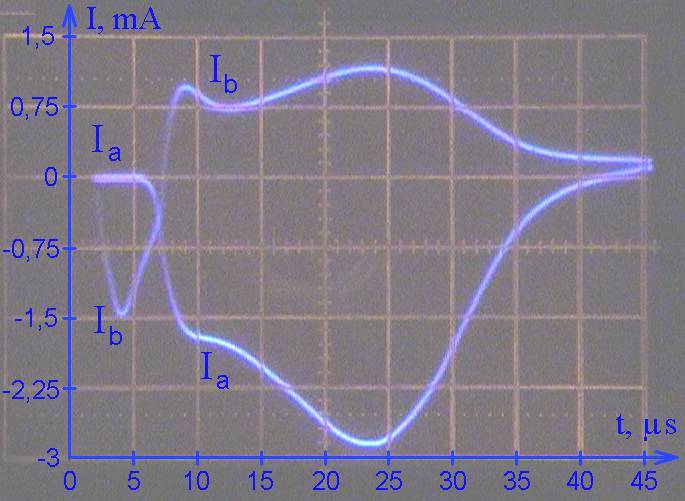
Fig. 11. "Splitting" of the total current
of breakdown and discharge
to the anode current Ia and the displacement current Ib
.
AtĀ fig. 12 the oscillogram of the anode
currentĀ Ia (t) and the
displacement current Ib (t) containing the prebreakdown periodĀ is given.Ā
In parallel to inputs of an oscillograph the voltage limiters on 0,6 V
are connected up.
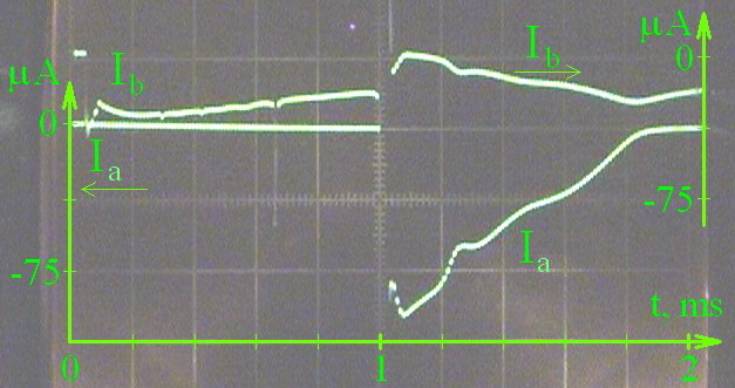
Fig. 12. The oscillogram of the anode currentĀ Ia (t) and the displacement current Ib (t)
containing the prebreakdown period.
At fig. 13 the assemblage
of 56 oscillograms of a plasma potential during the breakdown andĀ discharge at the triggering frequencyĀ 10 Hz is presented. One division across Ś 40
ms, the upper horizontal line Ś ½0,8 kV╗, lower Ś ½- 0,8 kV╗, middle Ś ½0
kV╗, and numbersĀ indicated lk
Ś the distance from a probe toĀ the
cathode cut in millimeters.
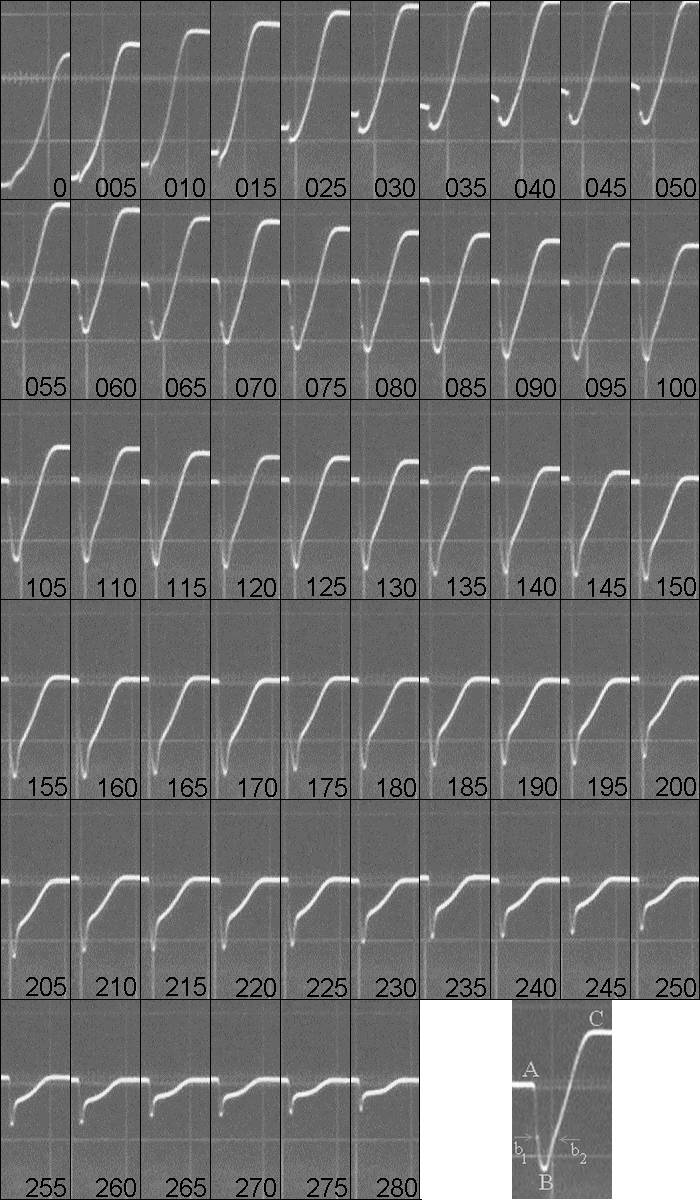
Fig. 13 The assemblage of 56 oscillograms of a plasma potential during
the breakdown andĀ discharge at the
triggering frequencyĀ 10 Hz. One division across Ś 40 ms, the upper horizontal
line Ś ½0,8 kV╗, lower Ś ½- 0,8 kV╗, middle Ś ½0 kV╗, and numbersĀ indicated lk Ś the distance from
a probe toĀ the cathode cut in
millimeters. The special points
of dependencesĀ the sense of which is
explained in the text furtherĀ are
marked at the insertion placed on the right and below.
Let's pay attention to
some special points at oscillograms, marked at the insertion
placed on the right and below at fig. 13.
UAĀ Ś the plasma potentialĀ before the front of the streamer,
Ub1 Ś potential behind
the front of the streamer,
UBĀ Ś potential of the streamer beforeĀ the back stroke wave,
Ub2 ŚĀ potential of the streamer after the back
stroke (the beginning of the discharge onto the anode),
UC (l) Ś potential of
plasma after the discharge,
Ub1-A ĀŚ the potential jump at the streamer front,
UBAĀĀ Ś the potential jump ofĀ the streamer.
Our capacitiveĀ probe measures only the alternative
potential changing sufficiently fast. Therefore zero lines at the oscillograms
at various values l do not correspond not only to zero of potential but even to
some single value. As the potential of the cathode falls almost up to zero when
the discharge is over (fig. 8), then we shall choose UC (l) as the
reference level.
At fig. 14 the remarkable assemblage of curves showing a distribution of some of the specified potentials
between the cathode and the anode of the discharge tube with the exception of a
site ofĀ big diameter (290 - 310 mm) and
close to it (285 - 290 mm) is presented.
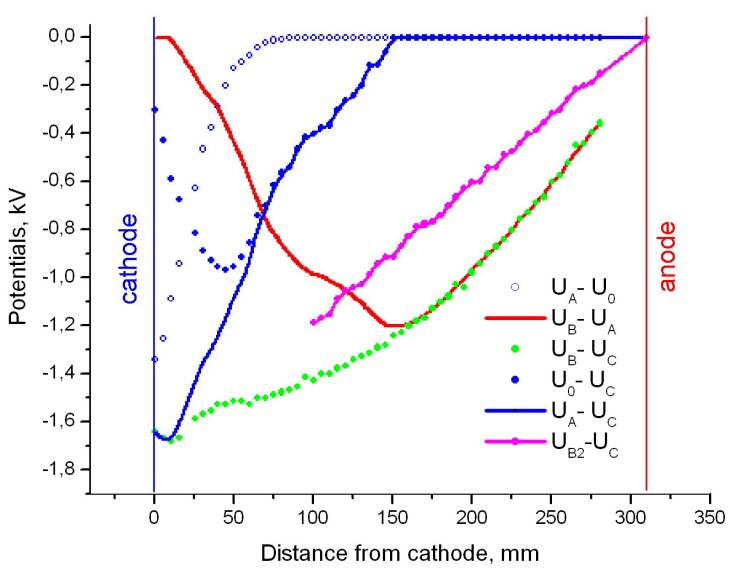
Fig. 14.
Distribution of potentials along a tube at the characteristic moments of
transient:
U0 ¢ UC Ś residual potential
to the triggering moment,
UA ¢ U0 Ś additon of
potential during theĀ prebreakdown
period,
UA ¢ UC Ś potential before
theĀ breakdown,
UB Ś UA Ś potential jump of theĀ streamer,
UB ¢ UC Ś potential before the back stroke,
UB2 ¢ UC Ś potential after the back stroke.
At increase of the
triggering frequencyĀ up to 400 Hz the
voltage ofĀ breakdown fell, duration of
the period from a start up toĀ breakdown
decreased, duration of the breakdown and the discharge decreased, and the
discharge current grew. The zone of a tube with residual potential expanded.
The near-cathode contraction alsoĀ was displaced to the cathode, it amplified
and enriched by stratum. Transition through the frequency 400 Hz was
accompanied by sharp increase of duration of a pulse of the breakdown-discharge
and full disappearance of the contraction. AtĀ
fig. 15 the images of a breakdown and a discharge in a cathodic half of
tube are given at frequency of triggering 50 Hz, and at fig. 16 - integrated
images of the near-cathode plasma at the triggering frequency 100 Hz.
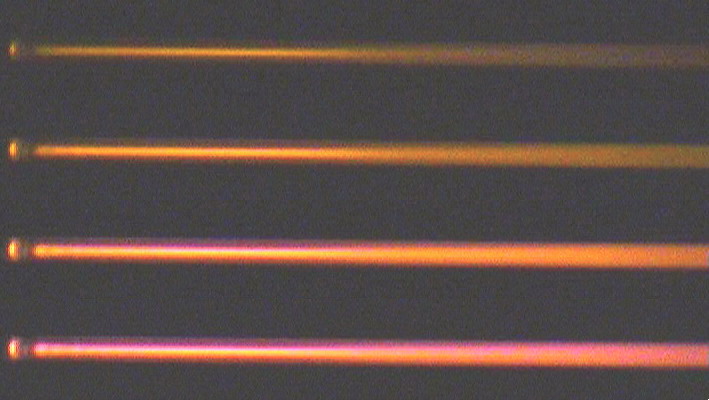
Fig. 15.
Stroboscopic images of a cathodic half of the tube made with a period 5 ms
at the triggering frequency 50 Hz.
.
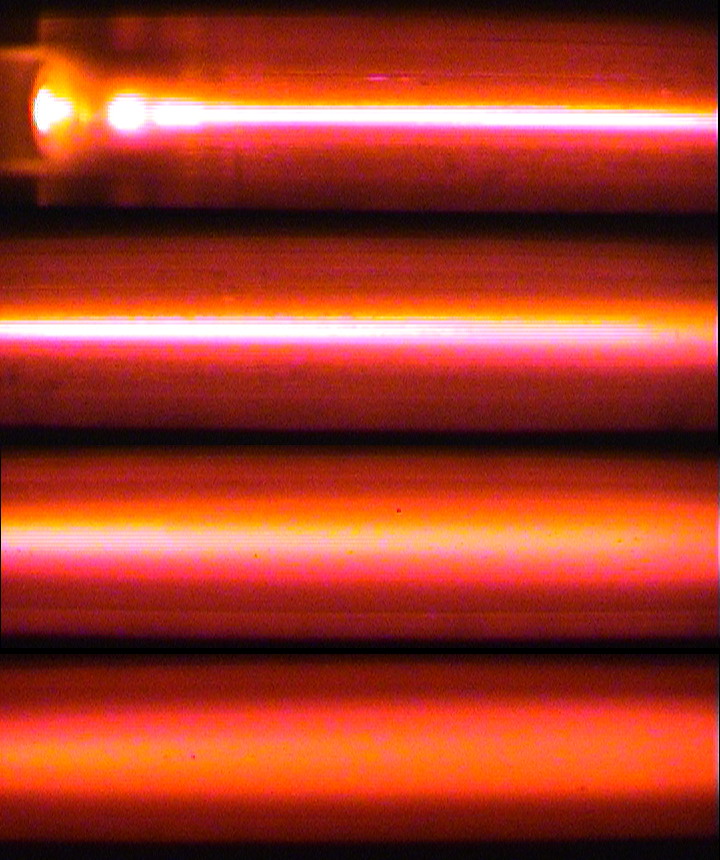
Fig. 16. Integrated
images of the near-cathode plasma
at the triggering frequency 100 Hz.
6.
The
brief description of the given case of a breakdown.
Let's
consider the transient occuring in a tube. It is essential that due to a periodic
mode, it begins not from the background concentration of charges in the gas,
determined by a radioactivity background, action of cosmic rays and being
random variable, but from the residual concentration which is small to form
plasmaĀ without breakdown, but it is
great enough not only to remove casual influence of the external factor, but
also as to change a cross structure of the discharge.
After a microsecond
charge of condenser C1Ā the
current IR1 appears in spurts going through resistor R1
and composed of the currents: IC2 ¢ the charge current of C2
, IC2P ¢ the charge currentĀ
of the supply conductor's capacity outside of a pipe C2P , ICA
¢ the charge current of the cathode capacity and the supply conductor's
capacity inside of a pipe CA and very weak cathode currentĀ Ś Ik . Apparently from Ia
(t) at fig. 12 the last one does not contain an essential current ontoĀ the anode up to the back stroke and is a
component of the displacement current Ib (t).
Distribution of residual potential to the triggering momentĀĀ at frequency 10 Hz is presented at fig. 14
(U0 (t=0) - UC). It looks like "barrier" (for
electrons) located within a cathodic half of tube.ĀĀĀ The cathode current creates around a cathode the plasma of very
low concentration and with the electron excess. The negative charge (UA
¢ U0 (t=0)Ā at fig. 14) fills
in "hole" between the cathode and "barrier", and this
processĀ goes non-uniformly. At
dependences of the plasma potential up to 6 cm from the cathode the jumps to which
short impulses of a current correspondĀ
(fig. 12) are observed. In time their size grows, and the position moves
away from the cathode. It - the short streamers which are not finishing by a
breakdown. In the view of the characteristic fall of plasma potential and
increase of a current previous to them the completed streamer (resulting to a
breakdown) also should be referred to this sequence.
Before the beginning of
the concluding streamer theĀ
distribution of potential along a tube (UA - UCĀ fig. 14) looks like the "slope"
stretching out up to the middle of a tube. It is visible from fig. 13Ā that birth of the streamer occurs in the
maximal field, the potential jump (UB ¢ UA at fig. 14)
becomes appreciable only after 15 mm mark. Here it has obvious feature: though
Ub1 ¢UAĀ is small
relative UA - UCĀ
but it is great relative UB ¢ Ub1 . At this site
the potential drop on length of the streamer is small. When l is about 95 mm
the point b1Ā appears in the
middle between A and B, and after l ~ 120 mm it can not be fixed at all. In the
middle of a tubeĀ the maximum ofĀ UB - UAĀ is, its distribution along a tube repeats
the shape of a current impulse of breakdown at fig. 11. AtĀ a culmination the streamer current reaches ~
- 1,5 mA. After passage of the middle of a tubeĀ the potential jump of the streamer decreases, and nearĀ anode only its small part is
still. Distribution of potential before a touch of the streamer with the anode
is presented at fig. 14 (UB ¢ UC ).
ĀShort circuit of plasma with the anode causes
a wave of potential redistributionĀ to a
condition determined by the plasma conductivity which is formed both direct and
a back wave (Ub2 ¢ UCĀ
Ķ±. 14) . This wave, the back stroke,
has in the beginning so abrupt front as well as the streamer but goes alongĀ plasma, already created by the streamer,
faster and fades to the cathode. The current of an excess negative charge taken off from plasma mixs up with the discharge currentĀ of all capacities charged earlier and flows
down onto the anode (fig. 10 and 11).
When a contact with the
anode the streamer currentĀĀ is less Āby third than the maximal value -
0,5 mA, i.e. resistance of plasma is about 3 MW. During the discharge
the electron multiplication begins, and resistance has time to decrease almost
by the order. With reduction of the triggering periodĀ the initial concentration grows, therefore duration of the
breakdown-discharge impulseĀ decreases
while current grows.
The streamer transit time of the interelectrode intervalĀ in length 0,31 m is about 5 ms, so the average speed
of breakdown in the given mode is only ~ 60 km/s. Maximal Āelectric power demand during the breakdown is
1,4 kV .1,4 mA = ~ 2 W, and total electric energy ~ 7 mJ.
- Features of a transverse structure of the discharge.
The contractionĀ concentrates within the near-cathode area, i.e.Ā where ions
collectĀ at the dark discharge [4]. It is
most expressed when the cathode potentialĀĀ
is supported at the trancritical level almost all time.Ā The received experimental data allow to put
forward the assumption of an essential influence of the non-quasi-neutral
plasma and its distribution on the characteristics of a breakdown and aĀ subsequent non-stationary discharge
concerning features of its transverse structure. The specified effects were
observed in atomic gas which is chemically poorly active as against molecular
gases and a dust plasmaĀ especially on
the basis of electrets [5].
(In
our opinionĀ simple variants of
installation can be used as the experimental part of a school study on the
phenomenon of a breakdown)
References.
1. Avramenko R. F. Ball lightning in the laboratory. Moscow:Chimiya, 1994. 256 p. (in
Russian)
2. Kirko D.L., Savjolov A.S.
The
current structure of a capillary dischargeÆs torch. Proc. ofĀ V Russian SeminarĀĀ ōModern means of plasma diagnostics andĀ application of them for matter and
environment controlö. Moscow, MIPhI, 27-29 july 2006. P. 106.
3. Emelin S.E., Pirozerski
A.L., Semenov V.S., Skvortsov G.E. Propagation characteristics of the
dynamic state in a capillary discharge jet.Ā
Tech. Phys. Lett. 23 (10), 1997. pp. 758-759
4. Raizer Yu.P. Physics of the gas discharge.
Moscow: Nauka. 1992. Ś 536 p.
5. Bychkov V.L. On the
electric charging of polymeric structures. Preprint MIPhI. Moscow: 1992,
16 p.
And how occur an electric breakdown
under the same conditions but in absence of Āthe prebreakdown period, at the
"momentary" appearance of a voltage?Ā
We shall know about it in New 2007 Year!
Ā